Whitby & Esk Valley Demographics
It is essential to understand the population in the area to be able to provide for them in terms of active travel facilities and get active.
Age Demographic
In tabular form, with actual population figures and for all parishes in the district, the data shown above is represented as
| Parish | – | 0-19 Years | 20-29 Years | 30-39 Years | 40-49 Years | 50-59 Years | 60-69 Years | 70+ Years | Total |
|---|---|---|---|---|---|---|---|---|---|
| Whitby | number | 2372 | 1181 | 1420 | 1431 | 2017 | 2123 | 2610 | 13154 |
| % | 18 | 9 | 11 | 11 | 15 | 16 | 20 | ||
| Eskdaleside | number | 334 | 153 | 178 | 192 | 366 | 436 | 603 | 2262 |
| % | 15 | 7 | 8 | 8 | 16 | 19 | 27 | ||
| Hinderwell | number | 329 | 150 | 159 | 170 | 291 | 285 | 400 | 1784 |
| % | 18 | 8 | 9 | 10 | 16 | 16 | 22 | ||
| Danby Group | number | 220 | 127 | 147 | 142 | 245 | 284 | 362 | 1527 |
| % | 14 | 8 | 10 | 9 | 16 | 19 | 24 | ||
| Fylingdales | number | 227 | 71 | 98 | 109 | 185 | 245 | 313 | 1248 |
| % | 18 | 6 | 8 | 9 | 15 | 20 | 25 | ||
| Glaisdale | number | 168 | 71 | 92 | 89 | 195 | 169 | 199 | 983 |
| % | 17 | 7 | 9 | 9 | 20 | 17 | 20 | ||
| Hawsker-cum-Stainsacre | number | 114 | 49 | 61 | 72 | 134 | 100 | 174 | 704 |
| % | 16 | 7 | 9 | 10 | 19 | 14 | 25 | ||
| Egton | number | 101 | 30 | 44 | 63 | 83 | 71 | 72 | 464 |
| % | 22 | 6 | 9 | 14 | 18 | 15 | 16 | ||
| Goathland | number | 31 | 25 | 20 | 39 | 69 | 84 | 106 | 374 |
| % | 8 | 7 | 5 | 10 | 18 | 22 | 28 | ||
| Lythe | number | 40 | 22 | 22 | 30 | 66 | 72 | 92 | 344 |
| % | 12 | 6 | 6 | 9 | 19 | 21 | 27 | ||
| Grosmont | number | 30 | 25 | 17 | 27 | 52 | 75 | 69 | 295 |
| % | 10 | 8 | 6 | 9 | 18 | 25 | 23 | ||
| Mickleby Group | number | 46 | 12 | 13 | 32 | 42 | 45 | 65 | 255 |
| % | 18 | 5 | 5 | 13 | 16 | 18 | 25 | ||
| Aislaby | number | 29 | 18 | 21 | 24 | 46 | 61 | 46 | 245 |
| % | 12 | 7 | 9 | 10 | 19 | 25 | 19 | ||
| Ugthorpe Group | number | 50 | 25 | 25 | 26 | 45 | 44 | 30 | 245 |
| % | 20 | 10 | 10 | 11 | 18 | 18 | 12 | ||
| Roxby Group | number | 31 | 16 | 14 | 24 | 38 | 37 | 37 | 197 |
| % | 16 | 8 | 7 | 12 | 19 | 19 | 19 | ||
| Newholm-cum-Dunsley | number | 32 | 19 | 11 | 22 | 34 | 37 | 39 | 194 |
| % | 16 | 10 | 6 | 11 | 18 | 19 | 20 | ||
| Sneaton | number | 30 | 13 | 26 | 24 | 26 | 30 | 45 | 194 |
| % | 15 | 7 | 13 | 12 | 13 | 15 | 23 | ||
| England (average) | % | 23 | 12 | 14 | 13 | 14 | 11 | 13 |
In accordance with our data transparency policy, this table is downloadable in spreadsheet format.
Activity Levels
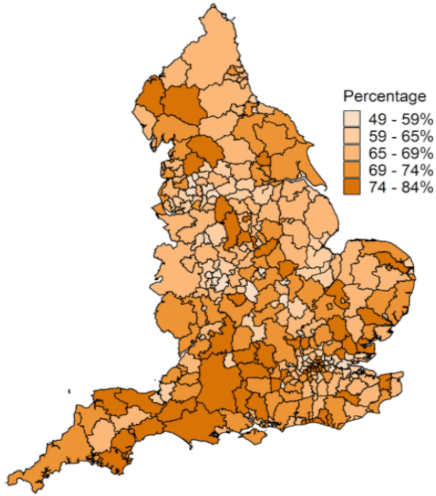
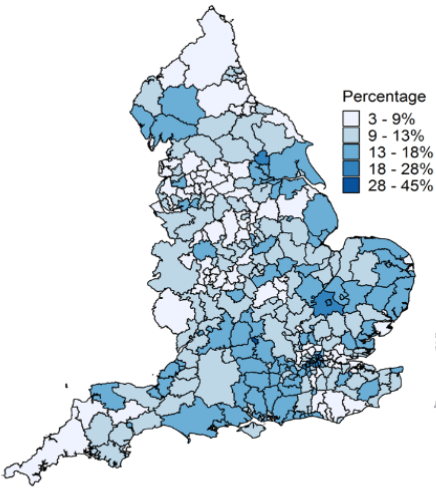
Activity levels in the Whitby and the Esk Valley area are not as high as they could be. The below maps show walking and cycling levels from the Active Lives Survey of 2020. Walking levels are average for the county, and indeed country. Cycling levels, on the other hand, are significantly below average, largely due to the presence of very little infrastructure.
If we look in general at the possible reasons behind these activity levels
- Walking – many parts of district not pedestrian-friendly – crossings providing priority for pedestrians are required in many places.
- Cycling – very little infrastructure and consequently the risk perception on roads takes over.
- Geography – hills put people off. The e-bike alleviates this for cyclists, as do better designed routes that choose lower gradients.
- Road Traffic Levels – volume of cars, car sizes/speeds.
- Risk Perception – puts people off using a bike or even walking when infrastructure is lacking.
- Disability Barriers – access prevented in some places. Steep access to CinderTrack puts off disabled.
- Ageing Population – reduced perception of speed, increased risk.
We will now look in detail at the walking and cycling levels.
Walking Levels
In terms of walking, the numbers for Scarborough borough from this survey are more respectable relative to other boroughs in the council area, and around the average nationally, though still leaving plenty of room for improvement. As said, the borough has some of the best walks around, so infrastructure is seemingly not the limiting factor, maybe the lack of prioritisation for pedestrians is a factor in that with a lack of road crossing infrastructure in particular.
| %age of adults walking | Once/month | Once/week | Three/week | Five/week |
|---|---|---|---|---|
| North Yorkshire (average) | 78.4 | 70.7 | 47 | 35.6 |
| Craven | 85.1 | 76.9 | 53.5 | 42.7 |
| Ryedale | 79.5 | 72.1 | 50.2 | 39.4 |
| Harrogate | 78.8 | 68.9 | 45.6 | 34.8 |
| Hambleton | 78.7 | 72.4 | 44.8 | 38.1 |
| Selby | 77.8 | 71 | 45.1 | 29.5 |
| Richmondshire | 75.4 | 67.3 | 46.9 | 35.1 |
| Scarborough | 75.4 | 69.5 | 47.4 | 34.3 |
In accordance with our data transparency policy, this table is downloadable in spreadsheet format.
Cycling Levels
This survey showed, of all of the borough councils within North Yorkshire Council (NYC) area, the Scarborough borough has the lowest proportion of adults cycling once per week.
| %age of adults cycling | Once/month | Once/week | Three/week | Five/week |
|---|---|---|---|---|
| North Yorkshire (average) | 16 | 11.6 | 4.9 | 2.6 |
| Selby | 19.6 | 14.2 | 7.6 | 3.1 |
| Harrogate | 17.3 | 12.7 | 6 | 2.9 |
| Ryedale | 16.8 | 12 | 5.4 | 2.7 |
| Richmondshire | 15.2 | 11.2 | 2 | 0.9 |
| Hambleton | 14.9 | 11.8 | 4.3 | 2.8 |
| Craven | 14.8 | 10.7 | 1.7 | 1.2 |
| Scarborough | 12.5 | 8.3 | 4.8 | 2.9 |
In accordance with our data transparency policy, this table is downloadable in spreadsheet format.
It would be desirable to drill down to particular towns within the Scarborough borough to identify whether the problem is specific to certain towns. While there are no town-centric statistics in that survey, we can look at the amount of cycle infrastructure within the two largest towns in that borough.
| kms of cycle path | Scarborough | Whitby |
|---|---|---|
| Dedicated Cycle Path | 0 | 0 |
| On-Road Cycle Lane | 7.4 | 0 |
| Shared Path (CinderTrack) | 3.4 (10) | 2.5 (1) |
| Shared Path (Non-CinderTrack) | 6 | 0 |
| Total | 16.8 | 2.5 |
In accordance with our data transparency policy, this table is downloadable in spreadsheet format.
The numbers above for Scarborough urban area were obtained from a FOI request of NYC in March 2022 (nb further infrastructure has been provisioned since this date in Scarborough, so the gap is now larger), whilst the numbers for Whitby urban area we generated ourselves from knowledge of our town. The numbers in brackets for the CinderTrack are the number of safe-cycling access-points; namely that Whitby has just 1 in the urban area, and that being a steep ramp in a relatively inaccessible part of town! The Larpool Lane link to the CinderTrack in Whitby is not included here due to it being a dangerous road and not meeting the remit of “safe cycling”. Bear in mind also that the CinderTrack in Scarborough is now on to its second surface having had a surface for many years, whereas the Whitby end only finally gained a surface in 2021. It is clear that Whitby (urban area) has a far lower quantity (kms) of cycle path than Scarborough (urban area); it would be reasonable to conclude that the proportion of adults cycling at least once per week in Whitby is noticeably lower than in Scarborough, and that the cycling numbers for Whitby are amongst the lowest of any town in the NYC area.
We also have to draw a distinction here between someone using a bike as a leisure activity (once a week, say), and using it as a form of transport; the figures suggest that very few are in the latter category.
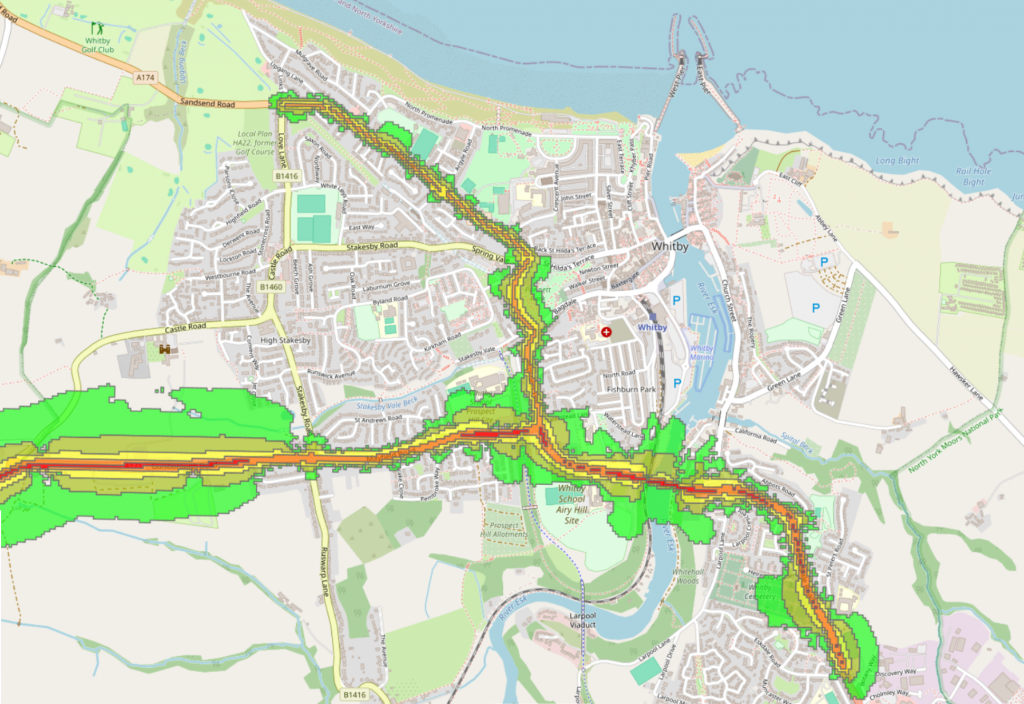
Vehicle Noise/Pollution Map
Please note also the road noise map for the largest urban population in the area, Whitby (Source: DEFRA/DfT, 2017, 24hr averaged road noise). This highlights the significant problem around the primary arterial roads and the impact of road traffic on the lives of residents in those areas. Note that this map is also indicatory of the levels of road particulates. Noise and particulates have direct and indirect linkage to physical and mental health of people in those areas. This is something that increased active travel (and reduced vehicular travel) can make a massive impact on. When designing an active travel network, the priority has to be around either avoiding the areas with high road noise, or implementing measures to reduce the noise.
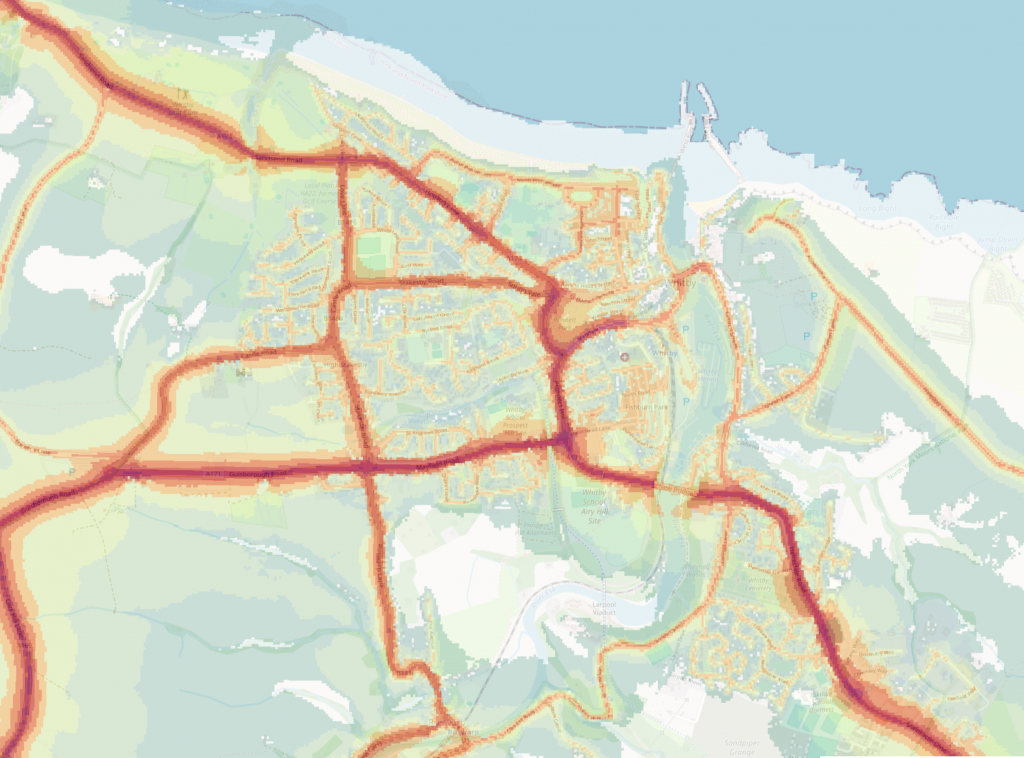
A dataset for 2024 is also available (Source: DEFRA/DfT, 2024, 24hr averaged road noise), with much more granularity and level of detail, but showing similar noise profiles, with the same key areas of the town being affected – hardly surprising since the traffic levels have only increased in size, but not changed in their distribution in the 7 years between datasets.
Highways Spend
Revenue costs (orange line in the graph) here (due to NYC accounting) do not separate the type of spend, and so contain roads, footpaths, drainage, grass cutting etc.
The obvious thing to comment on is the very low level of investment in active travel. Given that levels of active travel infrastructure are low for the county (unlike the situation for roads), and given the size of the county, this highlights how little impact this spend is going to have. With insufficient infrastructure one would expect a significant number of active travel capital projects to provide for this requirement. In 2021-2022 active travel capital spend accounted for just 3.5% of total highways capital spend. In 2022-2023 this rose to 9%. In 2023-2024 this fell to 6.9%. Finally in 2024-2025 this was 7.3%. The Local Plan (for the Whitby area) states an aim to “promote sustainable modes of transport” but this low level of funding will never achieve that. Bear in mind that Active Travel England recommend that a local highways authority spend 15% of their transport budget on active travel, something that NYC is a long way from achieving.
Regarding where the money was spent, if we look at 2024-2025 there was no scheme spend in Whitby and District, and the only spend during that year (that we are aware of) would be a limited amount of pathway repair to the CinderTrack near Fylingthorpe. Moreover, the majority of the “active travel” capital spend in 2024-2025 was on footway improvements (i.e path resurfacing), and so the amount spent on cycle improvements was actually very low indeed (£300k on 2 schemes in Harrogate, and £41k on cycleway improvements elsewhere). This is similar to previous years, where the only specific cycleway investments seem to be also in the Harrogate area in 2021-2022.
The only significant active travel spend (and not NYC either) within Whitby and District in the last few years was £315k spent on the surface to the Cinder Track between Whitby and Hawsker in 2021 provided by DfT/Sustrans.
The 2024 CinderTrack Cloughton-Burniston improvement £700k spend was provided by DfT/Sustrans (not NYC). Also the 2021 CinderTrack Scarborough urban area £850k spend was provided by DfT/Sustrans (not NYC). In addition around £2.4m has been spent on cycle infrastructure in Scarborough using their Town Deal funding (between 2022 and 2025), but not listed in the (capital) responses from NYC.